~2 MIN
Intro
Thanks to the newly released “Stats” section on Raider.IO, we now have access to deeper analytics on player performance and success in Mythic+ dungeons. Week 2 of Season 2 in The War Within has just wrapped up. Although the dust hasn’t settled yet due to current dungeon imbalance and ongoing class/spec tuning, and some early data may not be fully accurate, we can still take a look at the bigger picture.


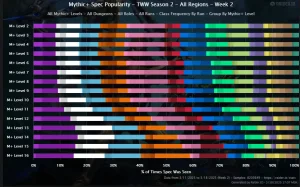
Spec Popularity by Key Level
The chart below illustrates the popularity of specs and classes as the Mythic+ key level increases — starting from level 2 all the way to 16+. The more space a color-coded spec occupies in each bar, the more frequently that spec successfully ran a dungeon at that level.
This gives us insight into which classes and specializations are more favored as the difficulty increases, likely due to their stronger utility, survivability, or overall DPS/HPS output in M+ runs.
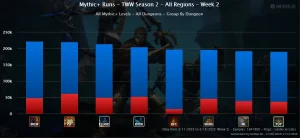
Mythic+ Dungeon Completion Success Rate
Another interesting metric is the completion rate of various Mythic+ dungeons, showing which instances are currently more challenging or player-friendly.
In the graph below:
- Blue represents dungeons completed in time (successful runs),
- Red shows the number of failed runs (not completed in time).
This helps identify which dungeons may have design bottlenecks or which ones players prefer due to routing ease, mob density, or boss mechanics.
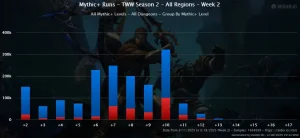
Key Level Completion Distribution
One more valuable chart reflects the key levels at which dungeons were completed. Once again, blue indicates timed runs, and red reflects failed runs at each specific level. This gives a clear view of the current skill curve, performance consistency, and group optimization trends across the Mythic+ ladder.